| ||
|
| ||
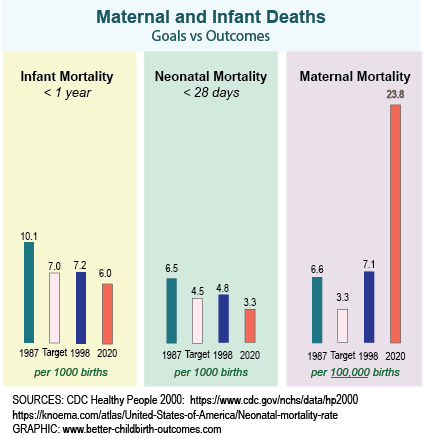
Decreasing Maternal MortalityThe best outcome is a health mother, healthy baby, both free of illness, who are breastfeeding and bonding with confidence. But what about the worse outcomes: when the mother does not survive?Reducing maternal mortality has been a priority since Healthy People 2000. (Source:https://www.cdc.gov/nchs/data/hp2000/hp2k01.pdf page 207 Objective 14.3) Not only did they not meet their target of reducing mortality from its baseline of 6.6 deaths per 100,000 births in 1987, but the death rate actually went UP. It continues to do so. So much for Healthy People and Better Childbirth Outcomes! Yes that's bad. But before we give up in despair let's look at the big picture and see - at least - part of the reason why this has happened. The goal of reducing infant mortality was ALMOST reached. Let's look at the stats and see what happened.
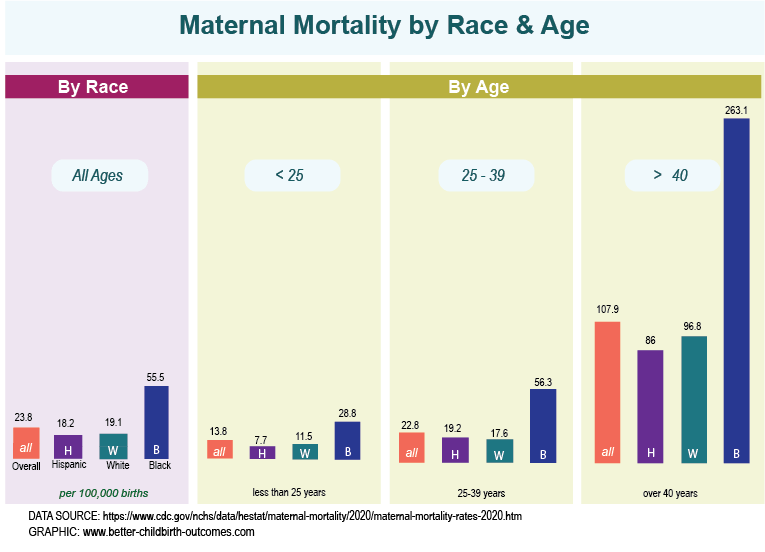
Why? The answer is multi-factorial. But a big part of the increase in maternal mortality is that cesareans have contributed to the decreased in deaths of infant at birth (leading to both lower neonatal mortality and lower infant mortality.) But those same cesareans have led - at least in part - to the increase in maternal mortality. Keep in mind as you look at those numbers that the deaths of infants are per 1000 births and of mothers per 100,000 births. We will discuss the significance of that below. Closer Look at 2020 StatisticsLet's look closer at the CDC statistics for maternal mortality for 2020.Maternal mortality is 23.8 in United States (more than double the rate of 1987).
By Race
By Age
By Total NumberThe chart and statistics above give the chance of death per 100,000 women in that grouping. The total numbers are different, showing more deaths per white women. This is because there are more white women in the US in 2020 than the other two groups.
Comparison to International Mortality RatesThe United States does not fair particularly well in maternal mortality compared to many other countries. You may read facts like "the USA is #44 in 2020." While the statement is true, it doesn't tell you much if you don't know how many countries are in the assessment. It turns out that the US is #44 of 186 countries for LOWEST maternal mortality - meaning 43 countries are doing better. (Therefore it is #122 out of 186 countries for highest mortality rate - meaning 122 countries are doing worse.) That is 33 percent of countries are doing better; and 66 percent of countries are doing worse.However, considering that the United States spends the most money, the statistics just aren't impressive and need to be improved. Here are some comparisons:
African DescentThe higher rate of maternal mortality for Black women is alarming. Three broad reasons for the different outcomes include:
For instance, there is a significant difference in the United States in the percentage of Blacks and Whites that have private vs public insurance (QUOTE) and this could point to a difference in treatment by race - even if unintended. In most areas of the country, those with private insurance have more choices in terms of practices and hospitals, which may directly or indirectly create a systemic difference in access and outcome. At the same time, it should also be noted that 38 of the top 40 countries with the world's highest mortality rate are all African countries. (Source: https://www.indexmundi.com/g/r.aspx?v=2223) If you count Haiti whose population is primarily African-descent, 39 of the top 40 countries are Black. It is unlikely that the systems in an African country are racist against themselves. Is it caused by cultural differences? Some cultural differences may indeed contribute, but again the countries across Africa are culturally diverse so it's not likely to be the only factor or main factor. Genetic differences? Differences due to blood pressure/preeclampsia likely have a genetic component. Unfortunately, the statistics across the 50 United States are not detailed enough to track causes of death by race, and rates and cause of death of those of mixed race. Such statistics would help us better understand the role of genetics. But it is hard enough to get general data from 50 different states. Number of Deaths Per ObstetricianHere is another factor that often gets overlooked when discussing maternal mortality in the USA. There are approximately 700 maternal deaths per year in all fifty states. (Source: https://www.cdc.gov/grand-rounds/pp/2017/20171114-maternal-mortality.html) There are 21,000 obstetricians practicing in the country. (https://www.bls.gov/oes/current/oes291218.htm) Mathematically, that means each obstetrician encounters a maternal death once every 30 years. At most, they will see two deaths in their 40-year career.Keep in mind that maternal health care professionals get daily phone calls from multiple women with headaches and abdominal pain. Abdominal pain, specifically, is almost universal during pregnancy - but it's also one of the warning signs. It is hard to remain on the alert for an event that will happen once every 30 years, when one is getting calls on the symptoms two or three times a night! OB Residency: Another ThoughtWhile I know of no research indicating this, it has been my experience as a midwife that when physicians do talk about the maternal deaths they have witnessed, much of the time - I would dare say even most of the time - they are referring back to cases they saw as residents. If true, that leads to a few other questions:
Causes of Death
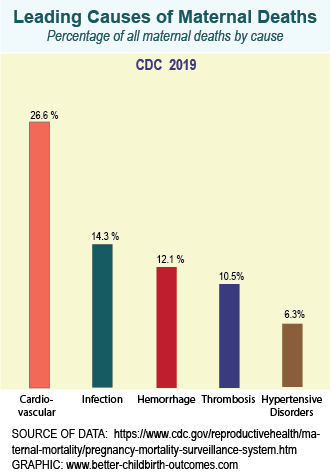
Maternal Mortality Causes in the USA
While the percentage of each cause is hard to find for international causes of maternal death, the major causes are the same. You will see some reversal of order year to year, but these are the major culprits. Cardiovascular and HypertensionThe combined cause of death by cardiovascular and hypertensive disorders is almost 33%. This corresponds to the increase death rate in all races over the age of 40.The increase in cardiovascular causes also contributes to the increase in maternal mortality in the last few years seen in the top chart above. Hemorrhage and InfectionAnother dismal statistic is that the maternal mortality increased over the last several decades as the fetal mortality decreased. See the chart above.The higher cesarean rate has had a role to play in those opposing trends. The higher number of cesareans led to decrease deaths for fetal distress but increased maternal death due to hemorrhage and infection. Recent SolutionsIn the last few years there have been a number of initiatives to decrease maternal mortality. Some of them have included:Danger Sign CampaignA campaign to alert patients to danger signs and early treatment have included posters, refrigerator magnets, bracelets, and other items to encourage mother's to seek early treatment.Racial ConcordanceIncreasing the number of black obstetricians and midwives - as well as other health care professionals - is another strategy. One way this accomplishes the goal is recognition of early signs. Remember the dilemma posed above: fatal cases are rare and the early signs are ubiquitous. Having a provider who shares the same cultural background can make it more effective for the provider to differentiate alarm or fear in a patient from the frequent worries over common symptoms.Postpartum Phone CallsPersonal phone calls, as well as text messages and postcards, have been sent to patients one to two weeks post-delivery. This helps to emphasize warning signs at a time when the family is not over-whelmed with initial instructions on baby-care and breastfeeding as they often are on the day of discharge.Another Proposed SolutionPackage Maternity Care by TrimestersHere is another proposal to aid in identifying at-risk mothers as well as potentially improving care to all pregnant patients: providing care packages by trimester.Rationale:
We recognize there are midwifery practices and birth centers that do not do routine ultrasounds. The contents of each "trimester package" will differ by region and practice as well as the trimester. The purpose of the trimester package is to stop, check on our routines, and talk to the patient. You think that is being done? I'm sure all providers think they are talking to their patients and their patients know the plan. But the feedback patients give me when I do a chart review with them is often that I'm the only one who has done so. They often perceive prenatal care as an endless chain of visits and tests. MAny patients in the lower socio-economic group miss half or more of their appointments with no perceived detriment on their part. If you are struggling with bus money, who cares if you miss an appointment? Packaging by trimester may also allow increased flexibility for less frequent visits in the first two trimesters of low-risk patients. It may include sheduling additional appointments and tests in advance for those who need them, and advanced schduling earlier can give them increased access to times that fit their schedule. |
||
|
|
||
|
By Karen Newell Copyright 2003 - 2012 Better Childbirth Outcomes - All Rights Reserved
Camp Hill, Pennsylvania, USA | ||


